“Half the money I spend on advertising is wasted; the trouble is, I don’t know which half.”
This famous lament from marketing pioneer John Wanamaker has haunted marketers for generations. But today’s digital marketing tools are helping us see the whole picture. Thanks to KPIs (key performance indicators), marketers can now track, measure, and optimize their campaigns with precision and confidence.
With the right social media KPIs, you can identify exactly what resonates with your audience, where your budget is best spent, and how to maximize your brand’s social impact.
In this guide, you’ll discover:
- Why your brand needs to track social media KPIs
- Which social media KPIs are relevant to your goals
- How to set up and track your social media KPIs
Let’s start!
What is a social media KPI?
KPI stands for key performance indicator.
A key performance indicator (KPI) is a critical metric that businesses use to track the efficacy of their campaigns and their progress towards marketing goals. In many cases, businesses will track multiple KPIs for different platforms and specific campaign types.
Specifically, social media KPIs are the metrics businesses use to track how their social media performance is stacking up against their predetermined goals for social media. By tracking specific metrics, such as engagement rate or video watch time, you’ll know if your social media strategy is working and your brand is achieving its business goals.
For example, say your business wanted to build brand awareness and reach more of your ideal customers. Then your Instagram goal might be to increase followers, and your KPI might be to increase the number of Instagram followers by 5% in Q1. In other words, you’ve applied a specific target and measure for the goal.
This post discusses common social media KPIs. For a full list of every metric that you can track through social media marketing, check out our social media metrics index.
The most important KPIs for 2025
Now that we’ve covered everything you need to know about what KPIs to track and how to select them, let’s discuss some of the most important KPIs for 2025.
And remember: This list is a recommendation, it’s not exhaustive. Choose the KPIs that best reflect your campaign goals and priorities.
- Share count: Shows that your content is valued by users enough to be shared, demonstrating relevance. Shares are also confirmed as being a critical engagement signal for Instagram’s algorithm.
- Response rates and times: Customers are increasingly using social media as a first-line customer support platform. Make sure you’re tracking your response rates and times to ensure that you’re delivering positive customer experiences even outside of your initial campaigns.
- Comments: Comments will always be important to track. High numbers of comments are good for all algorithm visibility. In addition to tracking the number of comments, however, try to make sure you’re also assessing the sentiment of the comments. Are people happy? Do they disagree, or find your post inaccurate? Keep this in mind, and look at the types of discussions your content is generating.
- Saves: If users like your content enough to save it, that means it’s valuable and relevant to them. Saves are a massive indication of quality and relevance. Someone might comment on a video they strongly disagree with, for example, but they won’t save it.
- Profile interactions: Understanding how many users will see a TikTok video and click to your profile and then potentially click to your linked site is important. Many brands don’t just want to keep customers on their social media sites or just have brand awareness; they’re part of larger-reaching goals to eventually drive other actions like sales, subscriptions, or donations.
- Share of voice: Standing out against the competition is an important part of helping your campaigns scale. It will be particularly important in 2025 for brands wanting to ensure that they’re reaching their target audience effectively.
- Video views: Video is will still be major in social media marketing in 2025. Video views can help you determine how many people were interested enough to start watching your content, helping you determine how to reach more users.
- Video completion rates: Video completion rates show how relevant and engaging content was to your audience. Use this metric to determine how many users watched your video all the way through. You can use what you learn to optimize future content based on high-value topics, video formats, and video length.
- Conversions: If you’re wondering which of these social media KPIs demonstrate social media ROI, it’s likely going to be conversions. Conversions can be more difficult to track, but again— many businesses want to eventually drive specific conversion actions and not just keep users on their social media accounts.
You can leverage different tools like Google Analytics and strategies like custom discount codes or UTMs to effectively track conversions from both paid and organic social media content.
How to pick the right KPIs
With so many possible social media KPIs to track, it’s essential that you choose the ones that match your goals. And given that goals vary from campaign to campaign, it’s not simply a case of picking a few now and forgetting about the rest. Instead, you’ll have to re-evaluate each time.
Ultimately, it comes down to key components of your social media strategy, including the following:
- Content type and style: Determine which KPIs you’ll track for different types of content. Educational infographics on Instagram, for example, should be tracked with shares and saves. Meanwhile, you might prioritize view completion rates on YouTube when assessing content quality and relevance.
- Community management: As you’re nurturing relationships on social media, some metrics may matter more than others. Comments and private messages, for example, matter more than just likes.
- Social’s role in your larger marketing plan: Is social media meant to build brand awareness, for example, in general? If so, visits to your profile, new follows, and reach are great metrics to track. If you feel that users need to visit your site to better learn about your brand, however, clicks are imperative.
The following list of social media KPIs is not platform-specific — we’ll look at those in the next section. Instead, these KPIs are listed by general business goals, such as reach, engagement, lead generation, conversions, and customer loyalty. Take time to consider what different KPIs can tell you and how they could help you track the progress of — and optimize — your campaigns.
Social media KPIs for reach
Reach KPIs measure how many people come across your social media accounts and posts. Reach is a quantity metric that shows your existing and potential audience, growth over time, and brand awareness.
- Followers: The number of followers your social media account has at a set time.
- Impressions: The number of times your post or account/profile has been seen. Note: This doesn’t necessarily mean the person who saw the post noticed it or read it. And it doesn’t distinguish between individual accounts. It only totals up the views. So one person could see the same post in their feed three times, which means three impressions.
- Post reach: The number of individual accounts that saw your post. In the previous example, when one person saw the same post three times, the post reach was one. So post reach is usually lower than impressions.
- Share of voice (SOV): How much visibility you have online compared to your competitors. In social media, it’s measured by brand mentions – i.e. the number of times your brand is mentioned compared to the number of times your competitors are mentioned.
- Web traffic: The number of times someone clicked from social media pages and content to your website. You can often track it with third-party analytics like Google Analytics.
Social media KPIs for engagement
Engagement KPIs measure how your audience is interacting with your brand, and it’s one of the most important social media metrics. Reaching thousands of people counts for nothing if they don’t show any interest in what you have to offer.
Simply put, engagement measures the amount of likes, shares, and comments that your content receives.
- Likes: The number of people who interact with a social post by clicking the like button. Likes are often considered a vanity metric, because they're the lowest for of interaction, but you can still use them decision-making on aspects like content creation and content curation. Likes also influence engagement algorithms.
- Shares: More deliberate than likes, this action involves sharing their content with friends either to their feeds or in a private message. High shares can indicate quality of the content.
- Comments: The number of times people comment either negatively or positively, it indicates your content is resonating in some way with your audience.
- Mentions: Someone tags your account to mention your brand in a post, comment, Story, or direct message. You can track mentions and view conversations containing your brand name with social listening software, such as mention.
- Clicks: The number of times a person clicks to read more in a post, or clicks on a link within the post. This metric shows engagement and how effective your content is at capturing interest.
Social media KPIs for conversions
Conversion KPIs measure how many social interactions convert into desired actions, like website visits, newsletter sign-ups, or purchases. They reflect how effective your social media strategy is and whether it’s leading to actionable outcomes.
- Conversion rate: The number of users who perform the actions described in your CTA (Call to Action) compared to the total number of clicks on that given post. For example, how many people visited your website or landing page, subscribed to your mailing list, or made a purchase after clicking the CTA.
- Click-through rate (CTR): The number of people who viewed your social media post and clicked on its CTA. It provides insight into whether your content captures your audience’s attention and inspires them to act.
- Sales revenue: How much revenue your campaigns have generated. You can use tools like Google Analytics or social commerce analytics to track this.
Social media KPIs for customer satisfaction
Customer satisfaction KPIs reveal how social media users think and feel about your brand. Social media interactions with your brand provide direct feedback for your business.
- Customer testimonials: Reviews posted by your customers to social media channels like Google My Business or Facebook demonstrate how they feel about your brand. Star ratings also provide a quick snapshot of how customers perceive your business.
- Response rate: How often you respond to users who reach out.
- Response times: How long does it take you, on average, to respond to user messages?
- Resolution rate: How quickly you resolve a customer’s problems.
- Customer satisfaction (CSAT) score: How happy customers are with your brand and services, collected through a post-interaction or post-purchase survey.
- Net promoter score (NPS): Tells you on a scale of 1-10 how likely customers would be to refer their friends or family to your brand.
Social media KPIs for community engagement
Community engagement involves interacting with an audience on social media to build a loyal following and to establish trust. Fostering communities on social media is going to be a massive focus going into 2025, and is one of the most significant social media trends marketers should be aware of.
As a result, it’s critical to track KPIs tied to community engagement. While this may vary by platform, it can include the following:
- Content engagement and sentiment: How often users engage with your content, and the overall sentiment.
- Response rates: How often you interact with users who interact with your brand. This can be an important part of building strong relationships.
- Event participation: Including sign-ups and attendance, how often users engage with events that you host or promote on social media.
- User-generated content (UGC): The amount of content featuring your brand or products that users are creating and sharing.
- Subscriptions or memberships: If you have Facebook Groups, Instagram Broadcast channels, or LinkedIn newsletters, see how many followers are joining those branch-off groups and engaging.
Social media KPIs by platform
In this section, we’ll look at the social media KPIs for each major platform.
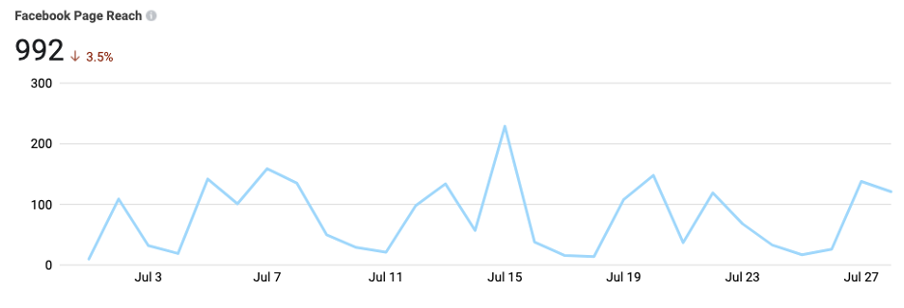
Meta's Business Suite lets you manage all of your connected accounts across Facebook and Instagram in one place. While many of the key metrics overlap, let’s break it out by platform.
Reach KPIs
- Followers
- Facebook Page Likes
- Post reach
- Post impressions
- Page reach
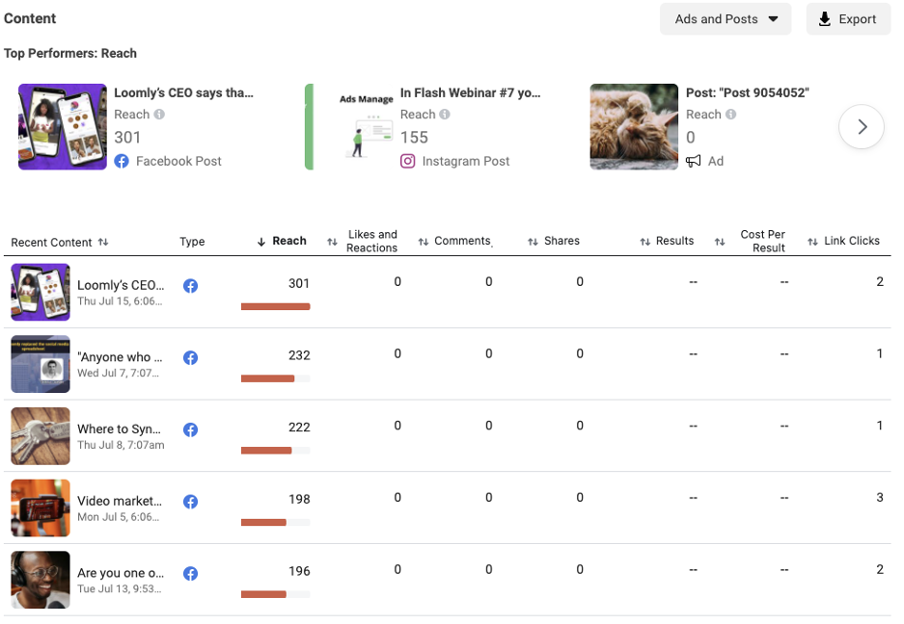
Engagement KPIs
- Likes and Reactions
- Comments
- Shares
- Results
- Cost Per Result
- Link Clicks
As noted above, Instagram and Facebook will have many similar KPIs since they’re both part of Meta’s platform. These are the metrics you’ll often want to track:
Reach KPIs
- Followers
- Page Likes
- Post reach
- Post impressions
- Page reach
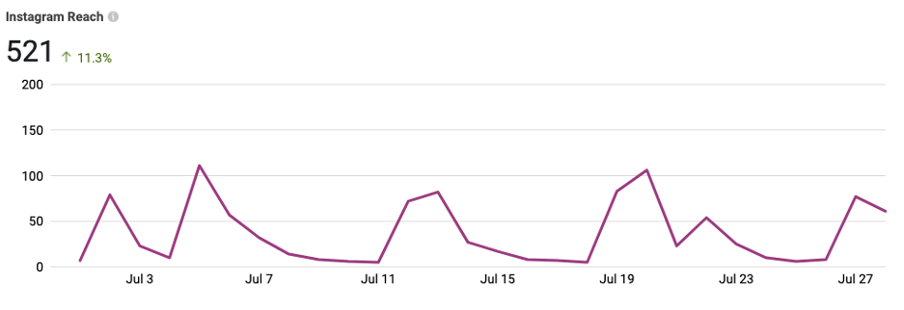
Engagement KPIs
- Likes and Reactions
- Comments
- Shares
- Results
- Cost Per Result
- Link Clicks
- Videos viewed
- View completion rates
- Profile views
- Story view rates
Instagram Reels KPIs
Reels are currently a high-performing feature on Instagram and Facebook. You can track these key metrics:
- Follows: The number of accounts that began following you after watching your Reel.
- Views: The number of times your reel begins to play or replay.
- Watch time: The total amount of time your reel was played, including any time spent replaying the reel.
- Average watch time: The average amount of time spent playing your reel, and is calculated by the watch time divided by the number of initial views.
- Accounts reached: The number of unique accounts that have seen your reel on screen at least once, whether or not your reel was played.
X (Twitter)
Reach KPIs:
- Followers: Total followers; New followers; Top follower.
- Impressions: Total impressions; Impressions per day; Individual Tweet impressions.
- Tweets: Total Tweets per period.
- Profile visits: Number of profile views per period.
Engagement KPIs:
- Likes
- Replies
- Retweets
- Follows
- Mentions
- Engagement rate: Number of engagements divided by impressions.
Conversion KPIs:
- Conversion rate: Conversion tracking.
Reach KPIs
- Followers: New organic followers; New sponsored followers; Follower demographics by location, job function, seniority, industry, or company size.
- Impressions: Impressions; Unique Impressions.
- Reach: Page Views; Unique Visitors; Visitor Demographics by top job functions, location, seniority, industry, or company size.
Engagement KPIs
- Reactions
- Comments
- Shares
- Follows
- Clicks: Custom button clicks
- Engagement rate
Conversion KPIs
- CTR
Employee advocacy KPIs
- Recommendations
- Posts from recommendations
- Reactions to posts
- Comments on posts
- Reshares of posts
YouTube
The Overview tab shows you a summary of how your channel and videos are performing. The key metrics card shows your views, watch time, subscribers, and estimated revenue (If you’re in the YouTube Partner Program).
Reach KPIs
- Subscribers: Subscribers gained; Subscribers lost
- Impressions: Impressions; Impressions click-through rate
- Reach: Views; Unique views
Engagement KPIs
- Likes: Likes; Dislikes; Likes vs. dislikes
- Shares: Number of users who share your content
- Comments: Comments added
- Viewing: Watch time (hours); Average view duration; Audience retention (% still watching at 0:30)
- Clicks: Card clicks; Clicks per cards shown; Card teaser clicks; Teaser clicks per card teasers shown
Revenue KPIs (YouTube Partner Program)
- Estimated revenue
- Transaction revenue
- Transactions
- Revenue per transaction
- YouTube ad revenue
- Estimated DoubleClick revenue
- Estimated AdSense revenue
TikTok
Reach KPIs
- Total followers
- New followers
- Growth rate
Engagement KPIs
- Profile views
- Video views
- Likes (Reactions)
- Shares
- Comments
Snapchat
Note: Snapchat Insights is currently only offered to influencers and brands who are verified or have a large following. From the Snapchat website: “Snapchatters who are Official Stories or creators who have cultivated a large audience on Snapchat have access to Insights!”
Reach KPIs
- Followers: Number of followers; Demographics
Engagement KPIs
- Views: Unique (Story) views: View time; Completion rate; Fall-off rate
- Likes: Number of screenshots
How to set up and track your social media KPIs
Before you can track your social media KPIs, you need to set them. Follow this 5-step plan:
1. Set SMART KPIs
After you’ve aligned your KPIs to your business goals, you can make your KPIs SMART. This stands for specific, measuravle, achievable, relevant, and time-bound. For example, if you want to build brand awareness on social media, you might use these platform-specific SMART KPIs:
- Increase Instagram followers by 10% in June
- Increase Twitter impressions by 30% in July
- Increase Facebook post reach by 5% in Q3
2. Benchmark your current performance
Make sure you benchmark your current performance metrics so that you can measure the KPIs. For example, if you had 10,000 Tweet impressions in June and you want to increase by 30% in July, then you know your target is 13,000 Tweet impressions.
4. Define your cadence for tracking KPIs
Decide how often you’re going to track your KPIs so you can see trends – e.g. weekly/monthly/ bimonthly. If you don’t track frequently, you can’t react quickly when things aren’t working.
5. Start tracking your KPIs
Now that you know how to set your social media KPIs, you need to track them. There are a couple of options:
1. Native platform analytics
Each social media platform has its built-in analytics, which is free and easy to use:
- Meta Business Suite allows you to manage your Facebook and Instagram business accounts
- YouTube
- TikTok
- Google My Business
These tools are fine when you’re starting or only have a few accounts to monitor. However, if you’re an agency tracking several accounts across several platforms, it can become tricky.
At that stage, you’re probably better off using a social media analytics tool that pulls multiple platform metrics into one dashboard.
2. Loomly Analytics
Loomly’s Advanced Analytics includes account, post, and link metrics. This means you can track big-picture and fine-tuned metrics for all of your social media presences across platforms from a single dashboard. No more jumping between apps to check different insight panels.
 You can automate elements of your KPI tracking by scheduling automatic exports of your metrics, tailoring the view to the right audience, e.g. stakeholders or clients.

Transform your social media strategy with the right KPIs
The landscape of social media marketing is constantly evolving, but one thing remains constant: what gets measured gets improved. By implementing the right KPIs for your brand, you're not just collecting data — you're gathering actionable insights that can transform your social media presence and drive real business results.
Remember these key takeaways:
- Choose KPIs that align with your specific business goals
- Focus on metrics that matter most for your target platforms
- Regularly review and adjust your KPIs as your strategy evolves
- Use the right tools to track and analyze your performance
Stop guessing and start knowing exactly how your social media efforts are performing. With Loomly's comprehensive analytics suite, you can:
- Track all your crucial KPIs in one unified dashboard
- Generate detailed performance reports in minutes
- Make data-driven decisions to optimize your content strategy
- Measure and prove your social media ROI
Start your free 15-day trial today and turn your social media data into actionable insights that drive results.
