To ensure the success of their LinkedIn profiles, businesses and individuals have to take a closer look at their Linked analytics to ensure their content is reaching and impacting the right audience.
In this article, we'll get you started with the essential components of LinkedIn analytics, including:
- What are LinkedIn analytics?
- How to access your LinkedIn analytics
- The 7 key LinkedIn metrics to track
- How to get laser focused on your LinkedIn analytics
- How to simplify your LinkedIn analysis and reporting process
Let's get started.
What is LinkedIn Analytics?
LinkedIn Analytics are a set of tools that provide users with valuable insights and data into the performance of their LinkedIn presence. With LinkedIn Analytics, users can track the number of views, engagements, and followers they have on their profile, as well as the demographics of their audience. This data can help users understand how their content is resonating with their target audience, and make informed decisions about their social media strategy.
For more information about how you can use LinkedIn to grow your network, check out our comprehensive guide to LinkedIn marketing.
How to access your LinkedIn Analytics
Here’s a step-by-step guide on how to access your LinkedIn analytics, so you can follow along as we delve into key metrics to focus on
How to access LinkedIn analytics on your personal account
- Log in to your LinkedIn account and navigate to your profile.
- Click on the Me icon in the top navigation bar. A dropdown menu will appear. Select View Profile.
- On your profile, scroll down until you see a module that says Analytics. At the bottom of this module, click Show all analytics.
- The Post impressions tab will bring you to your combined post analytics, where you can look at content performance by impressions, unique views, and engagement, as well as your top performing posts. The Total followers tab will bring you to your audience analytics, where you can see follower growth and demographics of your followers. If you have LinkedIn Premium, you will have access to more analytics.
- Customize your analytics by adjusting the date range using the dropdown menu located at the top left corner of the graph. This allows you to analyze your performance for specific time frames.
- Export data if needed by clicking on the Export button located at the top right corner of each analytics section.
By following these simple steps, you can access your LinkedIn analytics and start exploring the various metrics available. Using Loomly, you can track all your social media analytics from a single dashboard, so you can compare platform performance.

How to access LinkedIn analytics on your company page
- Log into the LinkedIn account from which you manage your company page. Note that only page admins or analyst access users can view analytics on a LinkedIn company page.
- Click on the Me icon in the top navigation bar. A dropdown menu will appear. Under the Manage section, select Company: [Your company name]. This will open your company page dashboard.
- On the left-hand panel, select Analytics. This will open your company page analytics dashboard.
- Use the tabs at the top of the dashboard to select the type of metrics you want to look at. You can choose Content, Visitors, Followers, Leads, Newsletters, Competitors, and Employee Advocacy. More on these options below.
- Under certain tabs you can customize your analytics by adjusting the date range using the dropdown menu located at the top left corner of the graph. This allows you to analyze your performance for specific time frames.
- Export data if needed by clicking on the Export button located at the top right corner of each analytics section.
All the LinkedIn company page metrics you can track
You company page tracks way more metrics than a personal page. Here's all the metrics you can track via your company page analytics dashboard:
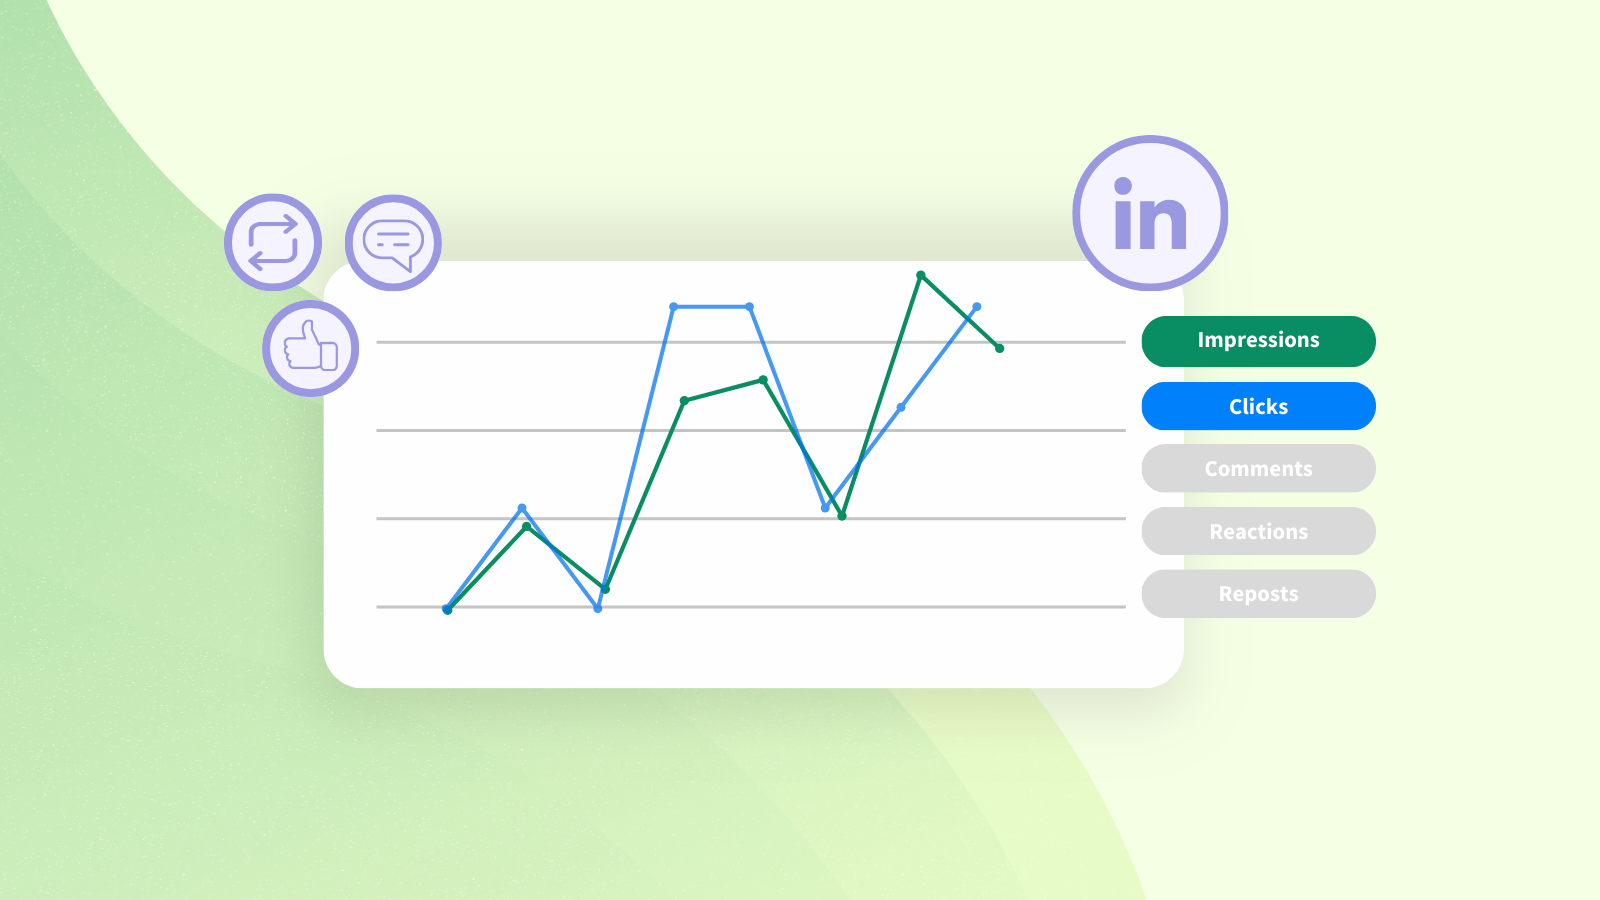
- Content metrics: Impressions, unique views, clicks, reactions, comments, reposts, and engagement rate, and click-through rate (CTR). You can also see the organic vs sponsored breakdown of these metrics, which is useful if you run LinkedIn ads.
- Visitor metrics: Page views, unique visitors, custom button clicks, and page visitor demographics (job function, company size, industry, location, seniority).
- Follower metrics: Total followers, new followers (and whether they came from an organic or paid channel), and followers demographics (job function, company size, industry, location, seniority). You can also see who visited your page from desktop or mobile.
- Lead metrics: If you create ads with a lead gen form, this is where you can see the number of leads generated.
- Newsletter metrics: If you publish newsletters on LinkedIn, this is where you can see metrics for article views and new subscribers, as well as total article impressions, engagements, and article views. You can also see subscriber demographics (job function, company size, industry, location, seniority).
- Competitor metrics: Once you've added competitors to track, this tab will show you total post output vs competitors, your total engagement rate vs competitors. You can also see individual competitor comparisons for new followers, post output, and engagement rate, plus get a look at their top trending posts.
- Employee advocacy metrics: If you use the feature that allows you to recommend posts to employees (found in the Page posts panel), this is where you can track number of recommendations, employee posts from recommendations, reactions to posts, comments on posts, and reposts. You can also see which of your employees is posting, the LinkedIn members they reached, and engagement metrics on their recommended posts.
- Campaign metrics: If you run LinkedIn ads, there are several metrics you can track inside of LinkedIn Campaign Manager. These include conversion tracking metrics (depending on your campaign goal, these could include leads, purchases, event registrations., etc.); engagement metrics like licks, impressions, and reactions; and audience data like job titles, company names, and industries.
Focus on these 7 key LinkedIn metrics
Most LinkedIn users can be classified into 2 categories — businesses and individuals. With over 20 different metrics measured on LinkedIn analytics, it is easy to get lost in a sea of numbers. Here are the top seven performance indicators that impact your LinkedIn visibility the most, either as an individual content creator or as a business.
1. Impressions
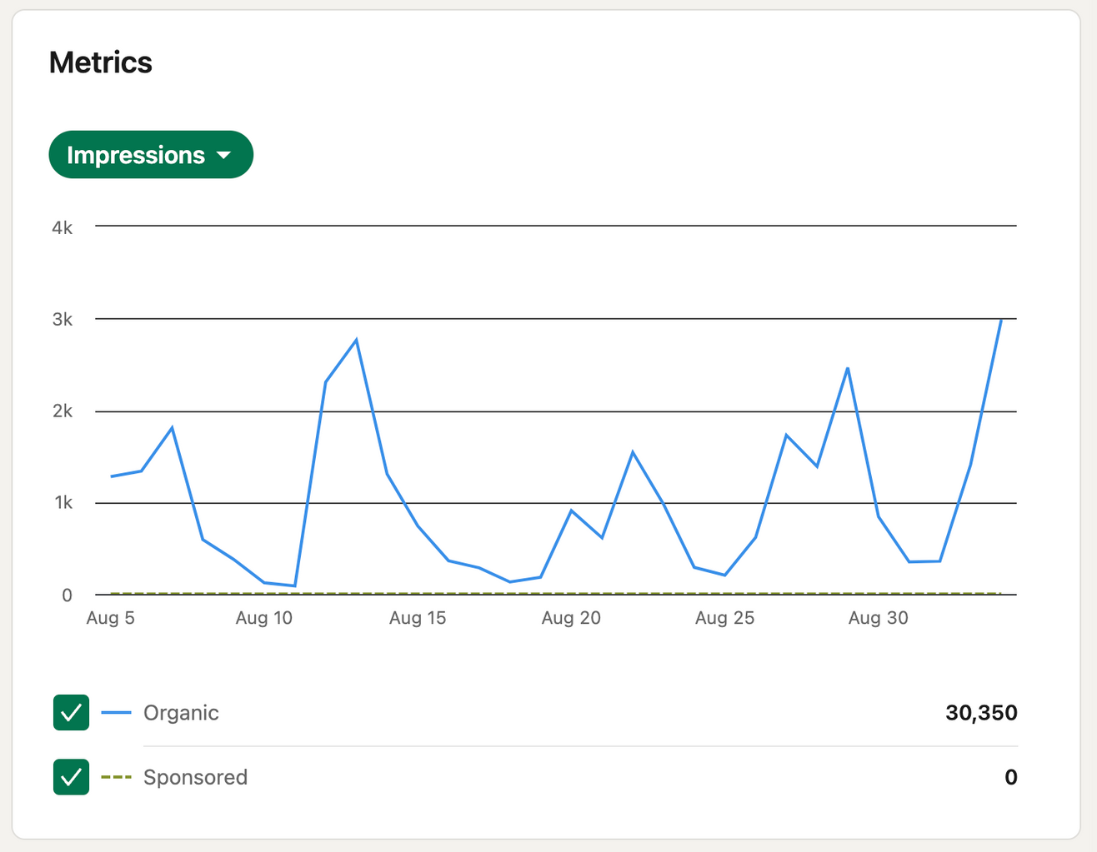 Impressions refer to the number of times your content, such as posts, updates, or articles, has been displayed on LinkedIn. This metric indicates the reach and exposure of your content. By tracking impressions, you can evaluate the effectiveness of your content strategy and identify opportunities to increase your visibility on the platform.
2. Click-through rate (CTR)
CTR measures the percentage of users who click on your content after seeing it. It is a vital metric that gauges the relevance and appeal of different content types to your target audience. A high CTR indicates that your content is compelling and enticing enough to attract clicks. By optimizing your content and headlines, you can increase your CTR and drive more traffic to your LinkedIn profile or website.
3. Engagement rate
Engagement rate gives actionable insight on the level of interaction and involvement your content generates from LinkedIn users; i.e. your content performance. It includes actions such as likes, comments, shares, and clicks. A high engagement rate indicates that your content is resonating with your audience and encourages them to actively participate. Engaging content can help build relationships, establish thought leadership, and expand your network on LinkedIn.
4. Followers
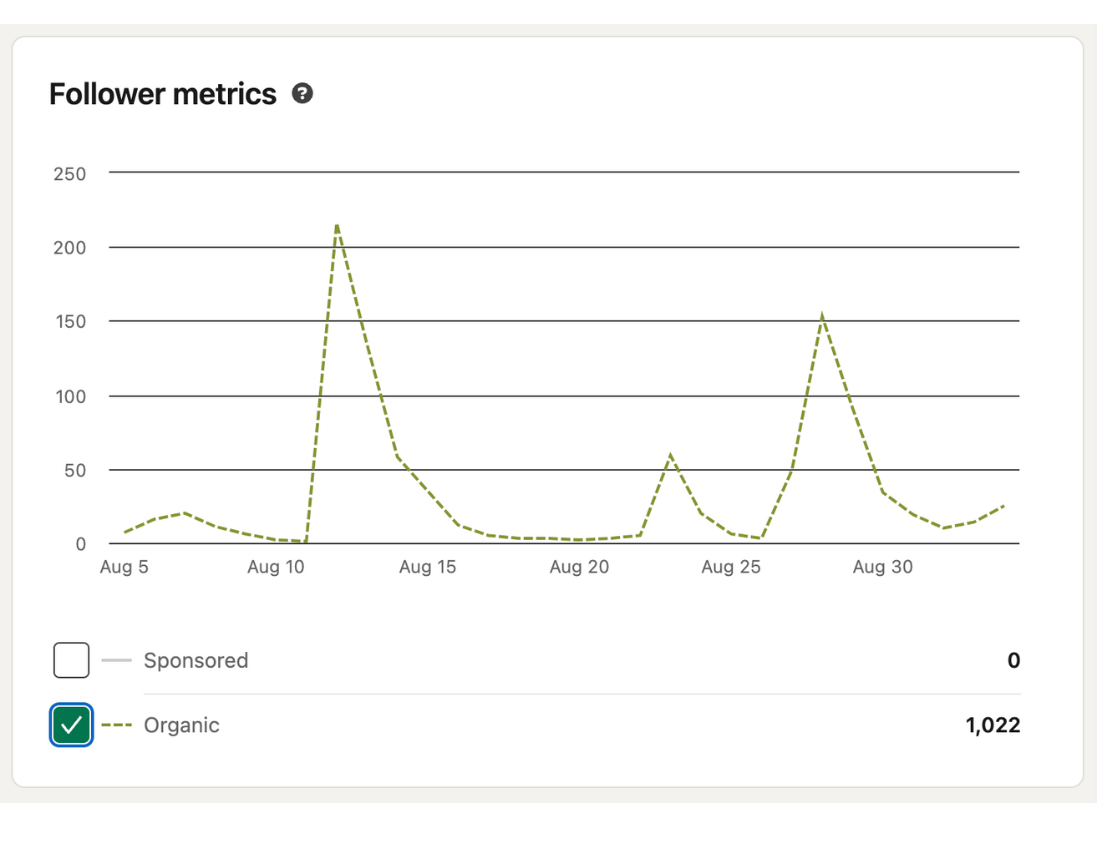 The number of followers represents the size of your LinkedIn audience and the potential reach of your content. It is an essential metric for both businesses and individuals, as it indicates the level of interest and trust your audience has in your brand or personal profile. Growing your follower base can amplify your content’s visibility and increase the likelihood of engagement and conversions.
5. Follower demographics
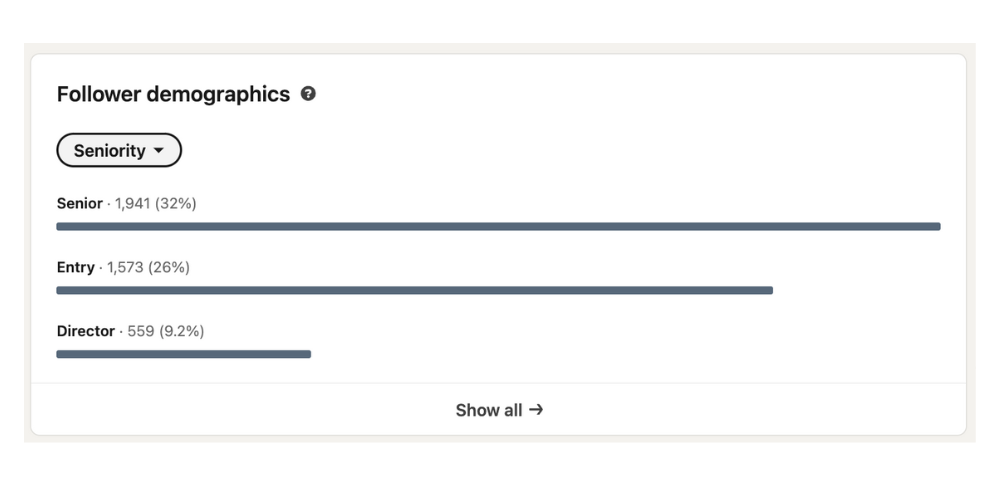
LinkedIn analytics provides data on follower demographics such as location, industry, job title, and seniority. Analyzing these demographics can help you tailor your content and messaging to better resonate with your audience’s interests and preferences. It enables you to create more targeted and relevant content, leading to higher engagement and stronger connections.
6. Profile visits
Profile visits measure the number of users who view your LinkedIn profile. It indicates the level of interest and curiosity users have in learning more about you or your business. By tracking profile views and visitor analytics, you can gauge the effectiveness of your LinkedIn profile, headline, and summary. A higher number of profile visits suggests that your profile is compelling and encourages users to explore further, leading to networking opportunities or business leads.
7. Conversion tracking
Conversion tracking is crucial for businesses on LinkedIn, as it measures the actions users take after engaging with your content. It can include form submissions, downloads, purchases, or any other desired action. By setting up conversion tracking, you can evaluate the ROI of your LinkedIn ads and determine their effectiveness in generating leads or driving conversions. This metric allows you to optimize your strategies and allocate resources to the most successful campaigns.
How to make the most of your LinkedIn Analytics
While every LinkedIn user has access to their analytics, what sets great profiles apart is what they do with the data they get. Here are a few key steps to take to ensure that you are getting the most out of your LinkedIn analytics regardless of your company size:
1. Set goals
Setting goals is the first and most crucial step in making the best use of your LinkedIn analytics. Before diving into the data, it’s important to identify what goals you want to achieve on the platform. Are you looking to increase your network, generate leads, or establish yourself as an industry thought leader on the social media platform? By setting clear goals, you can align your analytics efforts with your overall LinkedIn strategy.
Most importantly, ensure that your goals are SMART (Specific, Measurable, Achievable, Relevant and Time-Bound). Focusing on impossible goals like 10k followers in one month, when you’re just starting doesn’t make sense. Focus on your engagement rate and followers will come.

2. Monitor your competitors
LinkedIn analytics allows you to gain insights into your competitors’ performance and engagement levels. By keeping an eye on their activities, you can identify trends, discover new content ideas, and adapt your own strategy accordingly. This competitive intelligence can give you a competitive edge and help you stand out in your industry.
3. Set up conversion tracking
Setting up conversion tracking is crucial for measuring the effectiveness of your LinkedIn campaigns. By implementing conversion tracking, you can track specific actions that users take after engaging with your LinkedIn content, such as filling out a form or making a purchase. This data can provide valuable insights into the ROI of your LinkedIn efforts and help you optimize your campaigns for better results.
4. Use LinkedIn analytics in conjunction with Google Analytics
Using LinkedIn analytics in conjunction with Google Analytics can provide a more comprehensive view of your online presence. By integrating the two platforms, you can track and analyze data from both LinkedIn and your website, allowing you to understand the complete user journey. This integration enables you to identify how LinkedIn contributes to your overall website traffic, conversions, and other key metrics.
5. Experiment with different metrics
While we’ve discussed the top metrics to focus on, experimenting with different metrics is essential to understand what works best for your unique LinkedIn goals. Experimenting with different metrics, such as engagement rate, click-through rate, or follower growth, can help you identify the most meaningful metrics for your specific objectives.

6. Track referral traffic
Tracking referral traffic is another valuable aspect of LinkedIn analytics. By monitoring the sources of your website traffic, you can identify which LinkedIn activities or content are driving the most visitors to your website. This information can help you optimize your content strategy and focus on the types of content that resonate with your LinkedIn audience.
7. Use audience demographic data to influence messaging
LinkedIn analytics provides insights into the demographics of your audience, such as industry, job title, location, and seniority. By understanding your target audience’s characteristics, you can tailor your content and messaging to resonate with their needs and preferences, increasing the chances of engagement and conversions.
How to simplify your LinkedIn analysis and reporting process
Social media marketers rarely focus on a single platform. Instead, you're likely running several accounts across several platforms. When you're working with more than one platform, it's essential that you can track and compare performance across all of them — in one place.
That's why it's important to look for a social media management tool that gives you a single, all-encompassing view of your social media analytics. From this cross-platform vantage point you can easily compare KPIs across the board. When you're juggling many social media accounts, this is how you know which channels are your must-haves, where you can put less focus, and where to need to ramp up efforts.
Even better if your social media analytics tool is also your social media scheduler — so you can manage the entire content life cycle in a single browser tab!
Loomly is a comprehensive social media management tool that includes LinkedIn analytics among its features. Trusted by over 50,000 marketers, Loomly offers detailed metrics such as post performance, engagement rates, follower growth, and audience demographics.
This makes it super easy to keep a tab on your LinkedIn performance in comparison to other social media platforms, so you can see what content works for which platform. Try a 15-day free trial with no credit card required — it only takes a few minutes to connect your accounts and start tracking cross-platform data!